


 2 / 4
2 / 4


These new occupiers are increasingly driven by the
need to attract and retain talent. This is influencing the
type and quality of buildings and spaces they occupy.
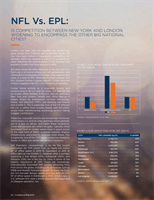
Buildings need to be sexy, not just efficient. This trend
is supported by CoStar data, which reveals that the
majority of space leased by banking and finance and
business and professional services in the big six U.S.
cities is prime, equivalent to the CoStar 4 & 5 Star
rating (see Exhibit 3).
Interestingly, space leased in the U.S. has been
relatively better quality than that occupied in the UK
in recent years. Moreover, the majority of leased TMT
space in the UK cities has been non-prime – 1 to 3 Star
– rather than the 4 & 5 Star buildings favoured in the
U.S. This reflects little development in the UK since
2008 and the consequential lack of new space.
The relative lack of available prime space in UK cities
has forced companies, especially in the TMT sector,
to occupy older stock. Developers have responded
by upgrading older buildings in CBD and city fringe
locations. We have noted a significant increase in
investment targeting UK buildings with refurbishment
potential. These refurbishments and redevelopments
have often formed part of wider economic and urban
regeneration schemes designed to create the kind of
places where people want to live and work. This is
an important attractor to new businesses looking to
relocate.
The lack of prime space in UK cities has kept average
rents for the TMT sector below those achieved in most
of the U.S. cities in our list (see Exhibit 4). San Francisco
is the most expensive market by far ($49.7/SF) and
Los Angeles ($12.6/SF) the cheapest. Although Bristol
is the most expensive UK city, the spread between it
and the cheapest – Leeds – is narrow. Consequently,
these cities cannot rely on price alone to compete
against each other. Hence, the need to offer other
attractions, such as the availability of skilled workers
and good quality of life.
The expansion of the TMT sector has meant that
average rents have increased markedly in a number
of markets. San Francisco rents have shot up 25% on
average (see Exhibit 5). Rent increases have been
much more subdued amongst the UK cities, reflecting
the preponderance of 1 to 3 Star buildings. This has
boosted the attractiveness of these cities, especially
for start-ups and SMEs that want low rents now but
have high growth potential. This is how clusters often
emerge.
EXHIBIT 3: QUALITY OF SPACE LEASED, 2014–15
EXHIBIT 4: TMT AVERAGE ACHIEVED RENTS $U.S., 2014–15
EXHIBIT 5: TMT AVERAGE ANNUAL RENTAL GROWTH,
2011–15
UK
Banking &
Finance
Professional &
Business Services
TMT
1-3 Star
27%
46%
54%
4&5 Star
73%
54%
46%
US
Banking &
Finance
Professional &
Business Services
TMT
1-3 Star
21%
31%
36%
4&5 Star
79%
69%
64%
SOURCE: COSTAR GROUP AS OF 16Q1
SOURCE: COSTAR GROUP AS OF 16Q1
SOURCE: COSTAR GROUP AS OF 16Q1
12.63
18.93 20.68 22.90 23.65 24.36 24.94 25.90 28.33 29.33 29.37
46.69
Los Angeles
Chicago
Leeds
San Francisco
Washington D.C.
Boston
Seattle
Bristol
Glasgow
Manchester
Birmingham
Rent/SF
Edinburgh
San Francisco
25%
Boston
13%
Los Angeles
13%
Edinburgh
12%
Seattle
9%
Chicago
8%
Glasgow
8%
Birmingham
6%
Bristol
5%
Leeds
2%
Manchester
1%
Washington
D.C.
1%
1%
5%
10%
15%
20%
25%
The Occupier Edge | 23